Your customers are more demanding than ever before. Improving field quality and your customers’ experience of your product is essential to staying competitive. However, truly understanding customer experience can be a daunting task. These recommendations have been refined and proven in dozens of manufacturers as simple ways to rapidly improve field quality performance.

1. Think big; start small.
The volume of product, process, and customer data that is being collected today is unprecedented. Data have gotten so big that term “Big Data” is going out of style. Warranty & service contract claims, call center records, telematics & sensor data, social media posts, sales records, product information, Bill of Materials, and many other sources contain valuable insights. But each only tells part of the story. Integrating these sources provides a holistic view of field quality. Unfortunately, in most organizations each data source exists in its own silo. To drive value quickly, it is important to think big, but start small.
Think big by creating a comprehensive data plan. Understand what data are available that could expand your understanding of customer experience and product performance. Gather a cross-functional team and brainstorm. Don’t stop at the obvious or the easy data. This big picture plan will become your roadmap.
The big picture is important, but it’s easy to get overwhelmed. That’s why you need to start small. Break the plan into phases. Start by focusing on a few key data sources that will drive the most
value. For most manufacturers, warranty claims are the most comprehensive, detailed information available for assessing field quality. However, claims aren’t enough. A few essentials need to be added to claim data to make it useful for anything beyond paying the service center. Sales information allows you to look at rates instead of counts. Product information lets you compare across assembly locations, build combinations and time. These data sources make up the core of a field quality analysis system.
2. Detect issues sooner.
Automated analytics can detect emerging issues months earlier.
You don’t have time to stumble across new quality issues or chase after false alarms. The longer it takes to find an issue, the longer it takes to resolve it. That means more defective products make it out the doors of your assembly plant. Automated analytics focus your problem solvers on the right issues and allow them to start the problem-solving process months earlier.
Analytics are critical, but not all “analytics” are created equal. Dashboards, trends, and point-to-point comparisons are not sufficient. Effective early warning analytics must:
- Set critical values based on historical patterns, not manual thresholds
- Monitor changes over build period, time in service, and event period simultaneously
- Filter out the noise of normal variation
- Account for seasonal patterns
- Tolerate the idiosyncrasies of field quality data
Automation is also critical. There are hundreds of thousands of combinations of things that can go wrong. And new data are being added constantly. It’s not practical to expect analysts and engineers to dig through all those data to find emerging field quality issues. The reality is that emerging issues will slip through the cracks for months or even years until they make their way to a top issue list. By then huge volumes of defective products will have entered the market. Automating the analytic process provides engineers and analysts with actionable insights that can be used to start the problem-solving process.
3. Accelerate problem resolution.
Whether an issue is detected through an automated, analytic early warning system or through a phone call from an irate executive, the next step is the same. Define exactly where, when and under what conditions the failures are occurring. The faster you can move from detection to correction, the more money you save.

Advanced analytics can identify potential root causes.
However, determining exactly where, when, and in what combinations parts are failing is often a long and arduous process. Analytics can improve your speed, accuracy, and precision beyond basic slicing and dicing. This allows you to efficiently focus your scarce resources and understand the true causal factors.
Unfortunately, trends, Paretos, and other standard visualizations are not sufficient. They can show you what the data look like, but they can’t tell you whether it’s normal variation, a significant pattern, or a wild goose chase.
However, analyses such as Decision Trees, Sequence Analysis, and Analysis of Means work well with field quality data and quickly isolate significant potential causal factors. This allows you to narrow your focus and get to the true root cause of the problem more quickly.
4. Communicate goals and progress.
Most manufacturers agree that reducing quality costs and improving customer satisfaction are strategic objectives. However, very few organizations communicate the necessary information needed for their people to align their personal goals to these strategic objectives.
To work together, team members need to know:
- What are the key metrics? When it comes to field quality, there is no shortage of things that are measured. The secret is to identify your organizations strategic objectives and focus on the metrics that most clearly measure those objectives. If a metric isn’t tied in one way or another to those strategic objectives, why track it?
- How are we doing? Now that your people know what to focus on, they need to understand the goals and current performance. Communicating this information in a hierarchical format helps them understand how individual business units, model lines and suppliers are doing and how they influence overall performance.
5. Learn from others.
There is no need to reinvent the wheel. Benchmarking your peers in other industries can quickly give you an advantage over your competitors. Manufacturers around the world have implemented the recommendations outlined in this article. Here are a few examples:
- A heavy truck manufacturer started small with warranty claims in one geographic region and through several expansions integrated data and systems from their operations around the
world. They also expanded to include customer calls, diagnostic trouble codes, and even telematics data streaming from vehicles in operation. - A global white goods manufacturer expanded their usage from North America to global, integrating data from multiple, regional claim processing systems. Doing so gave them a single version of the truth. But more importantly applying advanced analytics to the data reduced the time required to detect and resolve issues by 90 days, a huge step toward their goal of reducing cost of quality by 50%.
- A regional joint venture of a global automotive OEM was able to streamline data accessibility and disparate processes across both companies, enabling a 70% reduction in issue identification time and a 34% reduction in warranty costs.
- A global PC manufacturer customer call records and online reviews with warranty claims to better understand customer experience. Automated alerts and text-based insights led to a 13% reduction in warranty cost, and accelerated responsiveness to customer demands for new features.
- A luxury appliance manufacturer automated the coding of text-based service records, reducing coding errors and freeing up resources to solve problems. Automated analytics enabled them to reduce their already industry-leading resolution time by 4 months, cutting their Service Incident Rates by 14% in the first year and 50% over 5 years.
Benchmark Study: Analytics Detect, Prioritize, and Define Issues Months Earlier
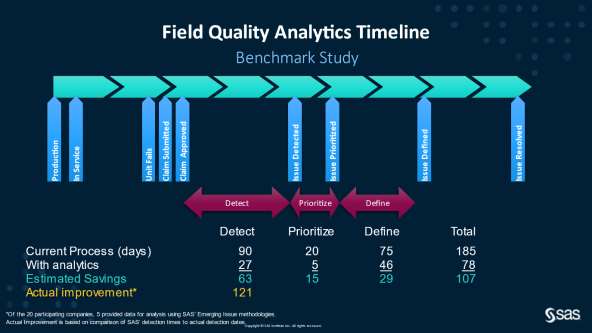
Manufacturers have proven that following these best practices takes months out of the problem-solving process, reduces warranty costs, and improves customer satisfaction. Each step along the journey is valuable. The key is to stay focused and learn from the success of others.
Learn more at www.sas.com/field-quality-analytics
By: Dave Froning
Sr. Manager, Product Management, IoT, SAS

About SAS in IoT
SAS empowers organizations to create and sustain business value from diverse IoT data and initiatives, whether that data is at the edge, in the cloud, or anywhere in between. Our robust, scalable, and open edge-to-cloud analytics platform delivers deep expertise in advanced analytics – including AI, machine learning, deep learning, and streaming analytics – to help customers reduce risk and boost business performance. Learn more about our industry and technology solutions at www.sas.com/iotsolutions